
Image Source: The Cleveland Museum of Art https://www.jstor.org/stable/community.24592825
Data Frames are a lot like spreadsheets or database tables. A data frame represents a data with a number of rows and columns. It looks like a matrix but its columns are not necessarily of the same data type (In matrix, all columns must belong to same data type). In data frames, rows are individual observations, which involves several different variables (columns)
Technically, data frames is a list whose elements are equal-length vectors, and that’s why it permits heterogeneity
A data frame is a natural way to represent such heterogeneous tabular data. Every element within a column must be of the same type, but different elements within a row may be of different types, that’s why we say that a data frame is a heterogeneous data structure.
In this article, we will create a data frame, subset it and run some useful functions that make working with data frames efficient.
Creating a Data Frame
We can use data.frame( ) function to create a data frame. We have to supply the data of each column by a vector of corresponding data type.
persons <- data.frame(Name =c("Siddharth", "Gayatri", "Kunal"),
                      Gender =c("Male", "Female", "Male"),
                      Age =c(24,25,23),
                      Subjects =c("Maths", "Science", "History"))

persons

    Name     Gender Age  Subjects
1 Siddharth  Male   24     Maths
2 Gayatri    Female 25    Science
3 Kunal      Male   23    History
Note that creating a data frame is exactly like creating a list. This is because, in essence, a data frame is a list in which each element is a vector and represents a table column and has the same number of elements.
We can coerce a data frame from a list by calling as.data.frame( ) function
temp_list <- list(Name =c("Siddharth", "Gayatri", "Kunal"),
                  Gender =c("Male", "Female", "Male"),
                  Age =c(24,25,23),
                  Subjects =c("Maths", "Science", "History"))

temp_list

$Name
[1] "Siddharth" "Gayatri" "Kunal"

$Gender
[1] "Male" "Female" "Male"

$Age
[1] 24 25 23

$Subjects
[1] "Maths"   "Science" "History"


as.data.frame(temp_list) # coerce the list into data frame.

 Name     Gender   Age  Subjects
1 Siddharth  Male   24     Maths
2 Gayatri    Female 25    Science
3 Kunal      Male   23    History
We can coerce a data frame from matrix with the same function. However, please note, since we are converting a matrix into a data frame, all the elements of the data frame will be of same data type.
temp_matrix <- matrix(c(1:6), nrow = 2)
temp_matrix

       [,1] [,2] [,3]
[1,]    1    3    5
[2,]    2    4    6

as.data.frame(temp_matrix)
       V1   V2   V3
[1,]    1    3    5
[2,]    2    4    6
Note that conversion automatically assigns column names to the new data frame.
Naming Rows and Columns
We can rename columns and rows just like we did for a matrix
col_name <-c("student_name", "sex", "student_age", "major")
row_name <-c("student 1","student 2","student 3")

colnames(persons) <- col_name
rownames(persons) <- row_name

persons

          student_name    sex   student_age   major
student 1 Siddharth     Male          24     Maths
student 2 Gayatri       Female        25    Science
student 3 Kunal         Male          23    History
Since data frame is a list of vectors/matrices all having the same length, it generally has two attributes, names attribute labeling the variables and row.names attribute labeling the individual observations. Please also note that data frame has its own class, making it easy to manipulate and work with other data frames.
attributes(persons)

$names
[1] "student_name" "sex" "student_age"  "major"

$class
[1] "data.frame"

$row.names
[1] student 1" "student 2" "student 3"
Subsetting a Data Frame
Since data frame is a matrix-like list of column vectors, we can use both sets of notations to access the elements and subsets in a data frame. We can use $ to extract the value of one column by its name or, we can use [[ to extract by column position.
persons$student_name # extract value by column name

[1] "Siddharth" "Gayatri"   "Kunal"

persons[[2]] # extract value by column position in data frame

[1] "Male"   "Female" "Male"
The sub-setting operator ([) allows us to use a numeric vector to extract columns by position, a character vector to extract columns by name, or a logical vector to extract columns by TRUE and FALSE selection:
persons[c(1,3)] # extract first and third column

         student_name  student_age
student 1 Siddharth       24
student 2 Gayatri         25
student 3 Kunal           23

# extract first column. The logical vector is recycled to match the length of data frame.

persons[c(TRUE,FALSE,FALSE)]

          student_name    major
student 1 Siddharth        Maths
student 2 Gayatri          Science
student 3 Kunal            History

persons[c("student_age", "student_name")]# the column position is changed

           student_age  student_name
student 1      24       Siddharth
student 2      25       Gayatri
student 3      23       Kunal
We can subset a data frame as a matrix by specifying row and column position [ row, column ]. The position vector can be numeric, character or logical vector.
Column Selection:
# extract all elements of _name and _age column

persons[,c("student_name","student_age")]

          student_name student_age
student 1 Siddharth       24
student 2 Gayatri         25
student 3 Kunal           23

persons[,c(1,2)] #extract all elements of first and second position column

          student_name    sex
student 1 Siddharth      Male
student 2 Gayatri        Female
student 3 Kunal          Male

# extract all elements of first and third column. Observe how the logical vector recycles its

length.persons[,c(TRUE,FALSE,TRUE), ]

          student_name  student_age   major
student 1 Siddharth            24     Maths
student 2 Gayatri              25    Science
student 3 Kunal                23    History
Row Selection
persons[c(1,2),] # extract first and second row elements of all columns

          student_name   sex  student_age   major
student 1 Siddharth     Male      24         Maths
student 2 Gayatri       Female    25         Science

# extract second and third row elements of all column

spersons[c(FALSE,TRUE,TRUE),]

          student_name    sex    student_age   major
student 2 Gayatri       Female    25          Science
student 3 Kunal         Male      23          History

persons[c("student 1","student 2"), ] # extract first and second row elements of all columns

          student_name    sex     student_age   major
student 1  Siddharth     Male      24          Maths
student 2  Gayatri       Female    25          Science
We can specify both selectors at the same time
persons[2,1] # extract second row element of first column

[1] "Gayatri"

# extract first row element of first and third column

persons[c(1,2),c(1,3)]

           student_name   student_age
student 1      Siddharth    24
student 2      Gayatri      25

# extract second row element of third and fourth column

persons[c(FALSE,TRUE),c(FALSE,FALSE,TRUE,TRUE)]

          student_age   major
student 2  25          Science

# extract first row element of student_name column

persons["student 1","student_name"]

[1] "Siddharth"
Please note, after you subset the data frame, the result will be the same class as the original data frame.(except if you extract a single column or observation)
class(persons[ ,c(1,3)]) # output is data frame

[1] "data.frame"

class(persons[,4]) # output is single column

[1] "character"

class(persons[2,3]) # output is single observation

[1] "numeric"
If you strictly want output as data frame class irrespective of edge cases (like user input selecting only one column or element), you can set drop=FALSE flag.
persons[,4,drop=FALSE]

            major
student 1   Maths
student 2   Science
student 3   History

class(persons[,4,drop=FALSE])

[1] "data.frame"

class(persons[2,3,drop=FALSE])

[1] "data.frame"
Setting Values
You can set values of the subset of a data frame as:
# change values of first three rows of third column

persons[1:3,3] <-c(41,42,43)

persons

         student_name    sex   student_age   major
student 1 Siddharth      Male     41          Maths
student 2 Gayatri        Female   42          Science
student 3 Kunal          Male     43          History

persons$student_name <-c("Sachin","Aarya","Mandar")

persons

         student_name    sex   student_age   major
student 1  Sachin       Male     41         Maths
student 2  Aarya        Female   42         Science
student 3  Mandar       Male     43         History
Useful functions for a Data Frame
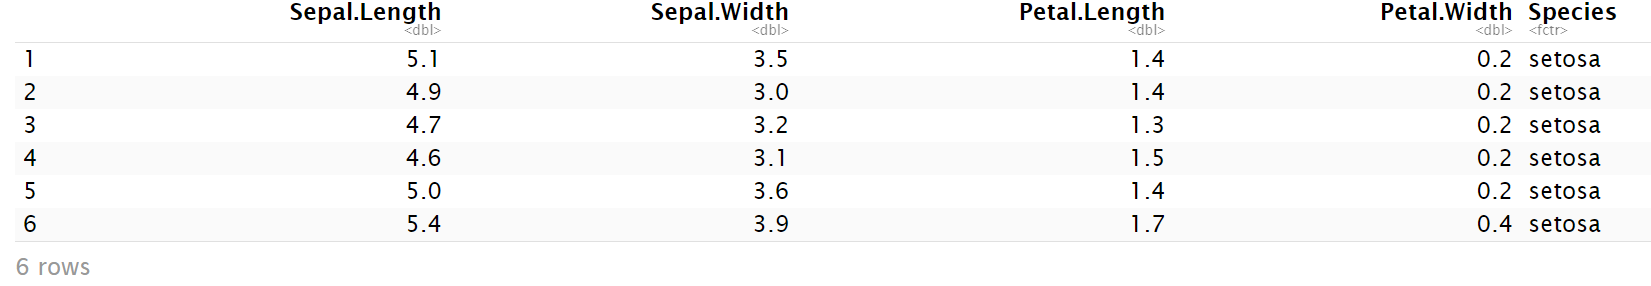
There are many useful functions for a data frame. Here are the ones with most commonly used functions are discussed. summary( ) function works with a data frame by generating a table that shows summary statistics of each column. Here is a summary statistics of iris data set from base R package. iris data set gives the measurements in centimeters of the variables sepal length and width and petal length and width, respectively, for 50 flowers from each of 3 species of iris.
head(iris) # prints first six rows of data set


summary(iris) # displays statistical summary of each variable in data frame

 Sepal.Length    Sepal.Width     Petal.Length    Petal.Width          Species
 Min.   :4.300   Min.   :2.000   Min.   :1.000   Min.   :0.100   setosa    :50
 1st Qu.:5.100   1st Qu.:2.800   1st Qu.:1.600   1st Qu.:0.300   versicolor:50
 Median :5.800   Median :3.000   Median :4.350   Median :1.300   virginica :50
 Mean   :5.843   Mean   :3.057   Mean   :3.758   Mean   :1.199
 3rd Qu.:6.400   3rd Qu.:3.300   3rd Qu.:5.100   3rd Qu.:1.800
 Max.   :7.900   Max.   :4.400   Max.   :6.900   Max.   :2.500
summary(iris) # displays statistical summary of each variable in data frame
Sepal.Length Sepal.Width Petal.Length Petal.Width Species
Min. :4.300 Min. :2.000 Min. :1.000 Min. :0.100 setosa :50
1st Qu.:5.100 1st Qu.:2.800 1st Qu.:1.600 1st Qu.:0.300 versicolor:50
Median :5.800 Median :3.000 Median :4.350 Median :1.300 virginica :50
Mean :5.843 Mean :3.057 Mean :3.758 Mean :1.199
3rd Qu.:6.400 3rd Qu.:3.300 3rd Qu.:5.100 3rd Qu.:1.800
Max. :7.900 Max. :4.400 Max. :6.900 Max. :2.500 For a numeric vector, the summary shows the important quantiles of the numbers. For Species, the summary counts the number of rows taking each value.
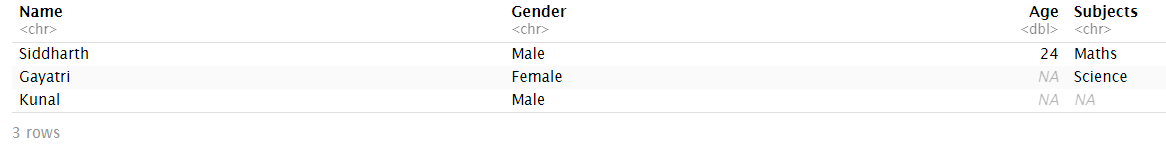
If the data frame contains any missing values, NA, then complete.cases( ) function returns a logical vector of length equal to the number of rows, and which contains a TRUE value for those rows that don’t have any NA values and FALSE for those that have at least one such value.
persons_NA <- data.frame(Name = c("Siddharth", "Gayatri", "Kunal"),
                      Gender = c("Male", "Female", "Male"),
                      Age = c(24,NA,NA),
                      Subjects = c("Maths", "Science", NA))
persons_NA


complete.cases(persons_NA)

[1]  TRUE FALSE FALSE
complete.cases(persons_NA)
[1] TRUE FALSE FALSE
You can observe, the entire first row does not contain any missing value, hence TRUE is displayed, while rows second and third has one missing value, hence FALSE is displayed.
If we want to append the data frame with new columns or rows, we can use rbind( ) or cbind( ) functions.
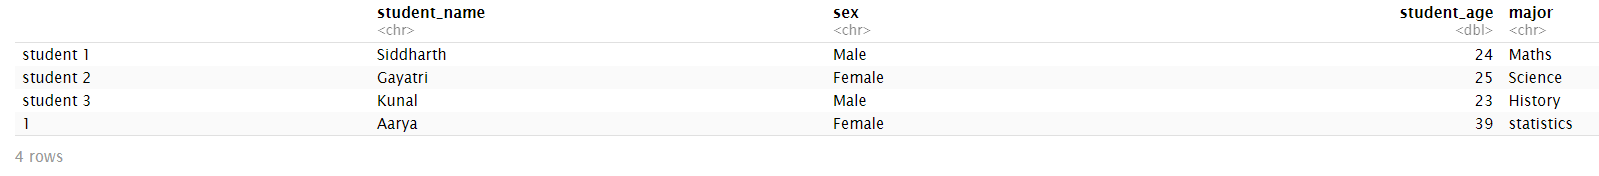
If we want to append new row to a data frame, in this case new entry of a student, we can use rbind( ) function.
rbind(persons,data.frame(student_name="Aarya",sex="Female",student_age = 39, major="statistics"))
If we want to append new column to a data frame, in this case grades received in each subject, we can use cbind( ) function.
cbind(persons,grades=c("A","A+","B"))

            student_name       sex   student_age    major        grades
                <chr>           <chr>   <dbl>      <chr>         <chr>
student 1	Siddharth	Male	24	   Maths	  A
student 2	Gayatri	       Female	25	  Science         A+
student 3	Kunal	        Male	23	  History	  B
Note that rbind( ) and cbind( ) do not modify the original data but create a new data frame with given rows or columns appended.
Summary
A data frame represents a data with a number of rows and columns. Unlike matrix, data frames can contain variables with different data types, therefor Data Frames are heterogeneous. This heterogeneity is seen because data frames are fundamentally a list whose elements are equal length vectors. We create a data frame using data.frame( ) function. Data frame can be coerced out of Matrices and list using as.data.frame( ) function.
There are many different methods to subset the data frames. We can use $ to extract the value of one column by its name or, use [[ to extract the value by column position. We can subset a data frame as a matrix by specifying row and column position [row, column].
Finally, we used some useful functions to work on data frames. summary( ) function generates summary statistics of data frame variables. complete.cases( ) function returns a logical vector indicating which cases are complete, i.e. have no missing values. We will be
using data frames in our analysis extensively.
When analyzing data, it’s quite common to encounter categorical values. R provides a good way to represent categorical values using factors. In the next article we will look at factors and their use in analysis.