
Image source: https://www.jstor.org/stable/community.31043819
Think back your first chemistry or biology lab course. As you entered into a lab, what was the first thing that were taught? It was not Chemistry or Biology. For most of us, the first instruction in lab course were about how to perform basic tasks like cleaning the equipment, zeroing the scale, labeling the beaker, and recording every step that you performed in a lab book.
Although, these menial tasks may not have been clear right away, these steps were all designed to ensure that, when you did conduct an experiment, you would be confident in the accuracy of your results and be able to clearly communicate what you did to someone else. These tasks would permit someone else to perform the same experiment and achieve the same result, verifying your findings.
In similar vein, if data scientist, while carrying out the data analyses, documents all the steps right from data gathering to final outcome in clean and transparent way, shares its work with other data scientist, then other data scientist can refer to this original work and build its own analyses on top of it, without recreating entire workflow again. This reproducible data science workflow helps in:
- Creating new analysis on top of original one without spending efforts into rebuilding entire analysis workflow
- Check correctness of the analysis carried out by other data scientist
In this article, we will have a look at the definition of reproducible data science, basic reproducible workflow template and best practices to be followed while performing reproducible data analysis.
What is reproducible data science?
Let’s define reproducibility
“In economics, computational biology, epidemiology, and clinical trials, reproducibilty is often defined as:
Page 4, The Practice of Reproducible Research : Case Studies and Lessons From the Data-Intensive Sciences, 2018
The ability of a researcher to duplicate the results of prior study using same materials as were used by the original investigator. That is, a second researcher might use the same raw data to build the same analysis files and implement the same statistical analysis in an attempt to yield the same results.”
In other words, if the analysis can be reproduced, it is valid and if it is not, then it could be one time occurrence that does not represent robust analysis.
The replicability is defined as:
” ability of a researcher to duplicate the results of a prior study if the same procedures are followed but new data are collected”
Page 4, The Practice of Reproducible Research : Case Studies and Lessons From the Data-Intensive Sciences, 2018
Reproducible data science refers to the practice of conducting data analysis and research in a manner that allows others to independently verify and reproduce the results. This involves documenting all steps of the data analysis process, including data collection, cleaning, analysis, and visualization, in a clear and transparent way.
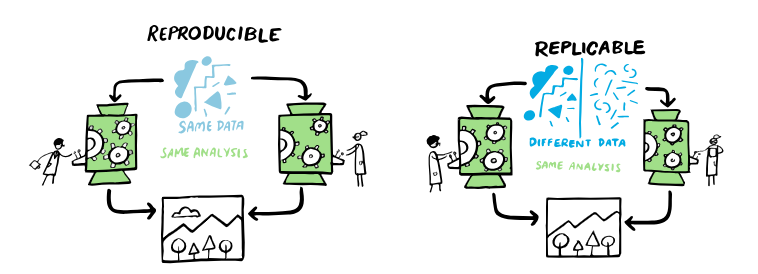
Image source: https://the-turing-way.netlify.app/index.html
Why reproducibility matters in Data science projects?
With the reproducibility in the analyses, one can produce the desired result in reasonable small effort.
In business setting, when you carry out data analysis to solve particular problem, you might not be able to collect the data in the most ideal way. The data features are limited and some of them may not be relevant to the analysis you are carrying out. The only thing you can guarantee is that your work is reproducible. If you write program in R or Python that embody every analysis step up to the creation of figures, and derivation of calculation, then such program can be immensely beneficial for another analyst to first reproduce the results and then further build upon these results.
Another benefit of reproducibility in the analysis is that it promotes standardization. Once the analysis template is standardized, it ensures entire analysis workflow from raw data to final report is tracked and documented. This prevents duplication of efforts, and less error in the analysis.
Reproducibility is even more important when GUI based “point and click” tools are used to produce the analysis. It is impossible to document how you used the GUI in such a way that someone else could produce the exact same results—on
the same data—six months later.
The basic reproducible workflow template
The basic reproducible workflow can be divided into three main stages:
- Data aquisition
- Data processing
- Data analysis
These three stages are preceded by activities related to system setup (use of personal computer or cloud computing for data intensive tasks), decision on which development environment to use for analysis (R/Python etc.).
The first stage is data acquisition. This stage consists of collecting data from a primary source, such as observations, experimental research or surveys. It may as well include acquiring data from an existing source, through writing SQL query on data base, through Web-scrapping, or generating data via simulation. The end result of the first stage is raw data.
The second stage involves cleaning the data produced in the first step. This stage includes tasks such as visual data review, removing missing values, dealing with outlines, manipulating or filtering part of data using programming. At the completion of this second stage, the relevant data is cleaned, and fully prepared for analysis. Experience says that more than 70% of data analysis effort goes into cleaning the data.
The third stage is data analysis. The activities in this stage involves exploratory data analysis, building predictive model and assessing its performance, or carrying out hypothesis testing to prove or disprove the scientific conclusion.
All the above steps are iterative. Since data analysis process itself is iterative, there will be many file versions that get created during analysis. It is best practice to use version control tools such as GitHub to properly store the files generated during each iteration.
Finally, the reproducibility of a project can be greatly enhanced through the creation of a single script that can automatically execute all three stages to produce the results.
Simple example of reproducible workflow
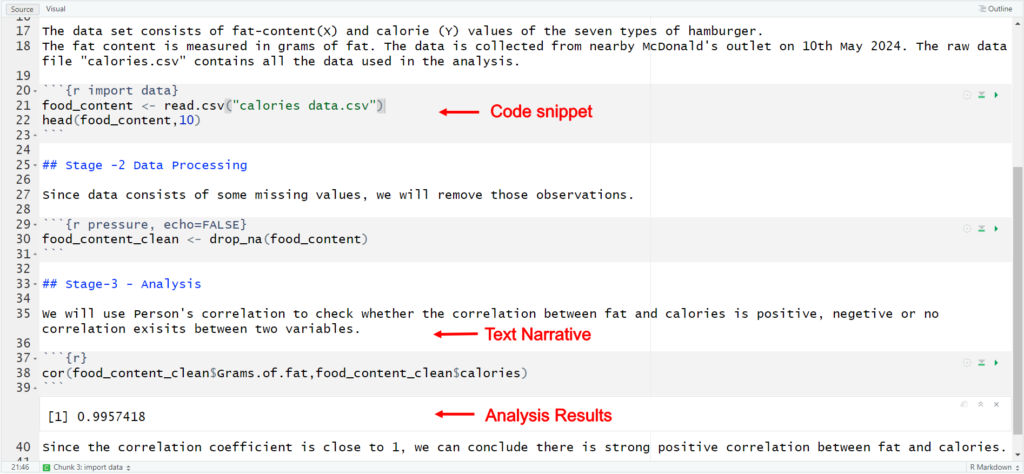
The first stage in a workflow is the acquisition of raw data. The hypothetical data set consists of fat-content and calorie values of the seven types of hamburger. The fat content is measured in grams of fat. The data is collected from nearby McDonald’s outlet on 10th May 2024. The raw data file “calories data.csv” contains all the data used in the analysis. .CSV file is a commonly used plain text format for storing tabular data.
Along with the raw data file, a metadata file should also be created and saved with it. This file can be simple text file that describes the source of the data and any relevant information about it. The following directory structure can be used for simple project. A single folder, let’s say called as Analysis is created. It has sub-directory called Data. The Data sub-directory has different types of data files – The raw data file and processed data file. It will also have meta-data text file which gives additional information on the data.
The analysis files are Rmarkdown file – which is dynamic document in R, The R script file – which enumerates all the coding steps, and .pdf file which is final analysis report. This file structure can be effectively used in simple analysis projects.

To make the data processing step fully reproducible, every step taken to process the data must be recorded. This can be achieved using computer code, in a script (R/Python script), that will read raw data, execute various processing and cleaning operations, and save the resulting processed data as a new file.
A word of caution, it could be tempting to open the spreadsheet program and delete the rows and columns that are not needed and save the resulting file. This manual intervention approach should be avoided, as this hinders the automated workflow and more prone to manual errors.
The final step is analysis step. For the demonstration purpose, we have used pearson correlation coeffiecient to check the correlation between two variables. This may be manually done using spreadsheet program. This is not recommended due to the difficulty of accurately capturing all the minute details needed to allow other data scientist to exactly repeat the analysis without errors. We generated the .Rmd file, which is RMarkdown file used for interactive data analysis. This approach involves creating a single source document, that contains text describing the analysis directly alongside code, figures, tables, and other results. This makes possible to create single source document, which can be executed to run the code and obtain results alongside narrative description and documentation.
Summary
Reproducible data science refers to the practice of conducting data analysis and research in a manner that allows others to independently verify and reproduce the results. Key aspects of reproducible data science includes:
- Use of automation workflow with computer code to perform data acquisition, data processing and data analysis steps
- documenting every step carried out during analysis phase
- Use of version control tools such as GitHub to properly manage iterative workflow
- Use of literate programming methods, such as RMarkdown to create single document, that contains text describing the analysis directly alongside code, figures, tables, and other results.
By adhering to these principles, reproducible data science enhances the transparency, reliability, and trustworthiness of analysis, resulting into collaboration and accurate insights.