It is possible to do lot of data work using Excel, Tableau, or any other Business Intelligence tools that have graphical interfaces. These BI tools are known for taking any kind of data from almost any system, and turning it into actionable insights with speed and ease. These tools are easy to use due to their point-and-click console, many data scientist do use these tools to create analysis. But can they be complete data science toolkit? We say NO
In this blog, we will look at advantages of programming for data science workflow. Programming has following advantages:
– Reproducibility
– Automation of repetitive tasks
– Flexibility in analysis
We will discuss these advantages one by one
What is reproducible data science work?
Let’s define reproducibility
“In economics, computational biology, epidemiology, and clinical trials, reproducibilty is often defined as:
Page 4, The Practice of Reproducible Research : Case Studies and Lessons From the Data-Intensive Sciences, 2018
The ability of a researcher to duplicate the results of prior study using same materials as were used by the original investigator. That is, a second researcher might use the same raw data to build the same analysis files and implement the same statistical analysis in an attempt to yield the same results.”
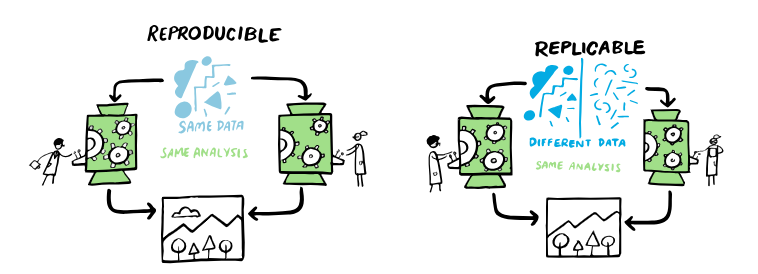
Extending above definition to Data Science workflow, Reproducibility is when some one else can obtain the same result from same data set when using the same analysis.
Reproducibility is different from replicability.
“The result is replicable, when the same analysis is performed on different data sets produces qualitatively same results.”
Guide to reproducible research
Both the definitions can be aptly described by following visual:
Let’s take a hypothetical example. You are working on sales data, which is .CSV file. You import the file in Excel, apply the filters to extract out the data for 3 months, removed the outliers and missing values and generated the summary values using Auto-filter function and record the result in new tab. You selected the columns and generated a nice time-series plot to show the sales trend.
That’s all fine!
After six months…
A stakeholder comes and asks you to reproduce entire analysis again, will you able to remember the steps?
You are asked to reproduce the work with new data. The new data is sales data which is piled up for the six months since you have prepared your first analysis. How much re-work is involved?
What happens if you share your excel file to your friend. She makes “few changes in the analysis” and sends it back to you. How will you know the changes?
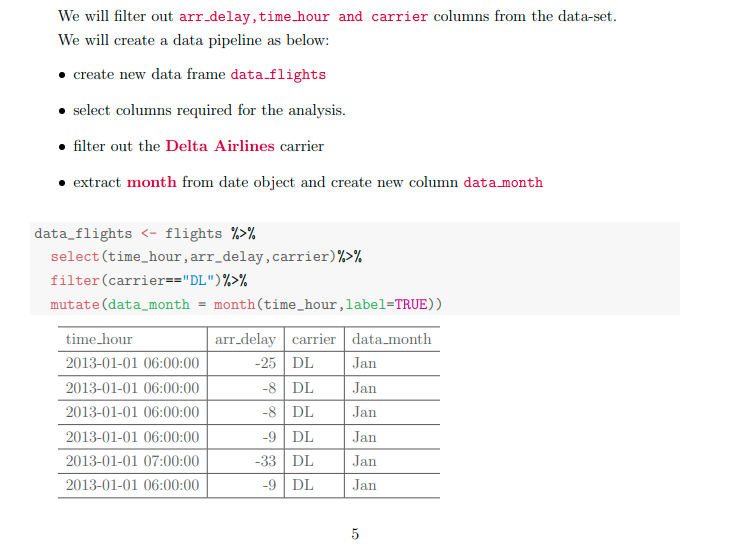
Let’s use the same scenario with any R programming language (or any other programming language…syntax will change but scenario shall remain same).
You want to analyse the same sales data. You import the CSV file using readr package. You extracted out the data for three months using time-series data extraction functions from lubridate package. You removed missing values and outliers, and selected the relevant columns using dplyr package. You used summarise( ) function, which is one of many in-built functions in R to generate the statistical summary. And finally you generated a nice line chart to show the sales trend using ggplot2 package, which gives you complete control over appearance and design of a plot.
All the steps you performed are documented in code, which means you can explain all those steps you performed while generating the analysis.
When the new data comes in, you don’t have to re-build the entire analysis. You will have to change only ONE line of code – the line where you selected the file to read in.
If someone else changes your code, you can use any number of tools to understand what they changed.
Using programming language, the analysis is built using series of written commands, and not remembering the steps of pointing and clicking. You don’t have to remember which button you clicked in which order to obtain the result.
Thus, if you share your work with your friend, with stored series of commands that are well commented, she can run the commands on same data set and generate the same result.
This reproducible data science workflow is biggest advantage of using programming to create the analysis.
Programming also helps in extending the code into literate programming environment (such as R Markdown), which is interface to weave together programming code, analysis results, visualizations and explanation of the analysis in single document. Such integration of many analysis artifacts (analysis results, code snippets, visualizations) is incredibly valuable, as all artifacts are automatically updated as the code changes.
Literate programming is a term introduced by Donald Knuth in the Computer Journal.
“My purpose in the present paper is to propose another motto that may be appropriate for the next decade, as we attempt to make further progress in the state of the art. I believe that the time is ripe for significantly better documentation of programs, and that we can best achieve this by considering programs to be works of literature. Hence, my title: “Literate Programming.”
Donald Knuth, The Computer Journal, Page 97-111, 1984
Automation of repetitive tasks
Programming is useful to automate the trivial tasks, sparing data scientists time to more challenging tasks that require creativity and innovation. Some of the tasks that can be automated with programming are:
– Data extraction and querying
– Data import and cleaning
– Data visualization
– Selection of right features to the model
– Tuning machine learning model
Automation helps in generating “push button” workflow reducing human intervention and manual errors.
Flexibility in Analysis
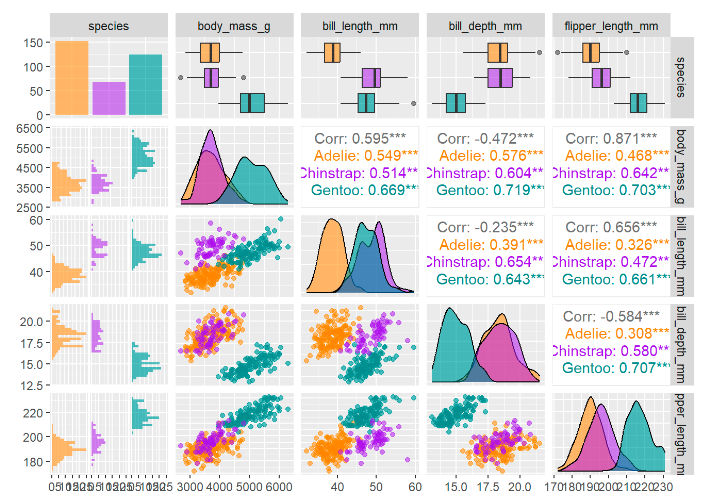
The third advantage of programming is flexibility. If Tableau doesn’t have a type of graph available, for example, you won’t be able to create it. But with programming, you can write your own code to make visualization that is ad-hoc and custom made for your analysis.
For e.g. generating a pair plot using programming language such as R is easy, however it may be daunting to generate such visualization in Power BI or Tableau.
Summary
Practically, very few companies have a data science team where you wouldn’t need to program. The advantages of mastering the programming far outweighs the initial efforts that may be required in learning it.
The first benefit of programming is reproducibility. We defined the reproducibility and its benefits for data science workflow.
Automation is the second advantage of programming. We can automate mundane and trivial tasks so that Data Scientist can focus his attention on more creative and challenging analysis.
Flexibility is the third advantage. Custom analysis and visualizations that might not be available in vendor-locked commercial applications can be created with the aid of programming.